Website overview screen
The first screen you see when you view a website is the Website Overview. This is your jumping-off point to access detailed information about this website.
The website overview looks like this (you may see fewer sections, depending on what modules you have purchased):
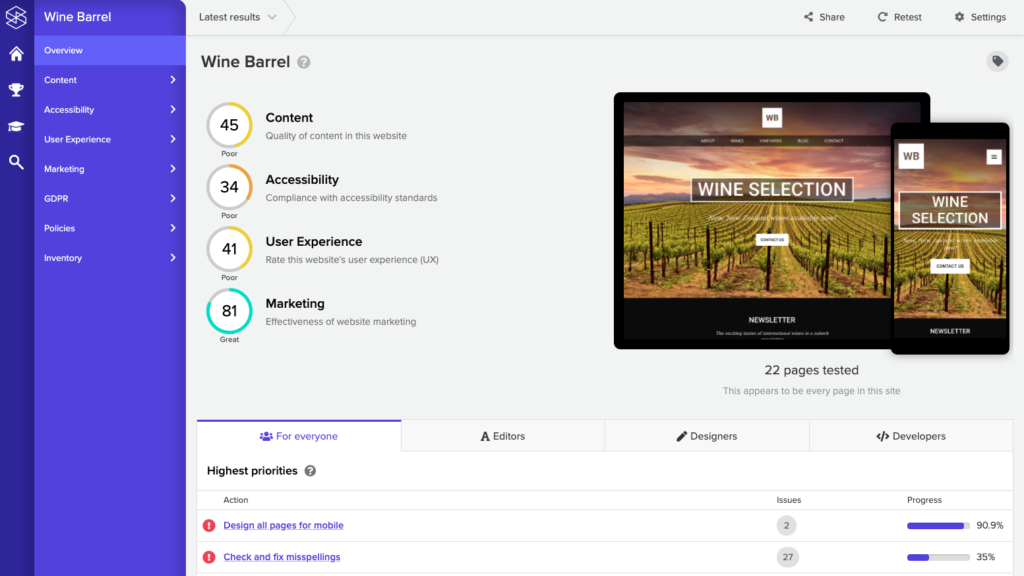
- Navigation – on the left-hand side in blue are the sections of the report – click one to explore it.
- Summary scores – the circles in the middle are the summary scores for different areas of the website. These scores range from 0 – 100, with higher numbers being better.
- Screenshots – the screenshots on the right-hand side show the homepage for this website on both a desktop and mobile device. This is helpful for ensuring you’re seeing the right website, and that it is up-to-date.
- Number of pages tested – below the screenshots is a short description of how many pages were tested by Silktide. There is also a rough estimate of how many more pages they could be, based on what Silktide found so far.
- Date selector – at the top is a drop-down menu which normally reads “Latest”. Select a different date here to view an older copy of the report you are viewing.
- Top actions – at the bottom is a tabbed list of top actions for this website. The tabs represent specific areas of responsibility, like “Editors” or “Developers”. Actions are sorted with the most severe actions listed first.