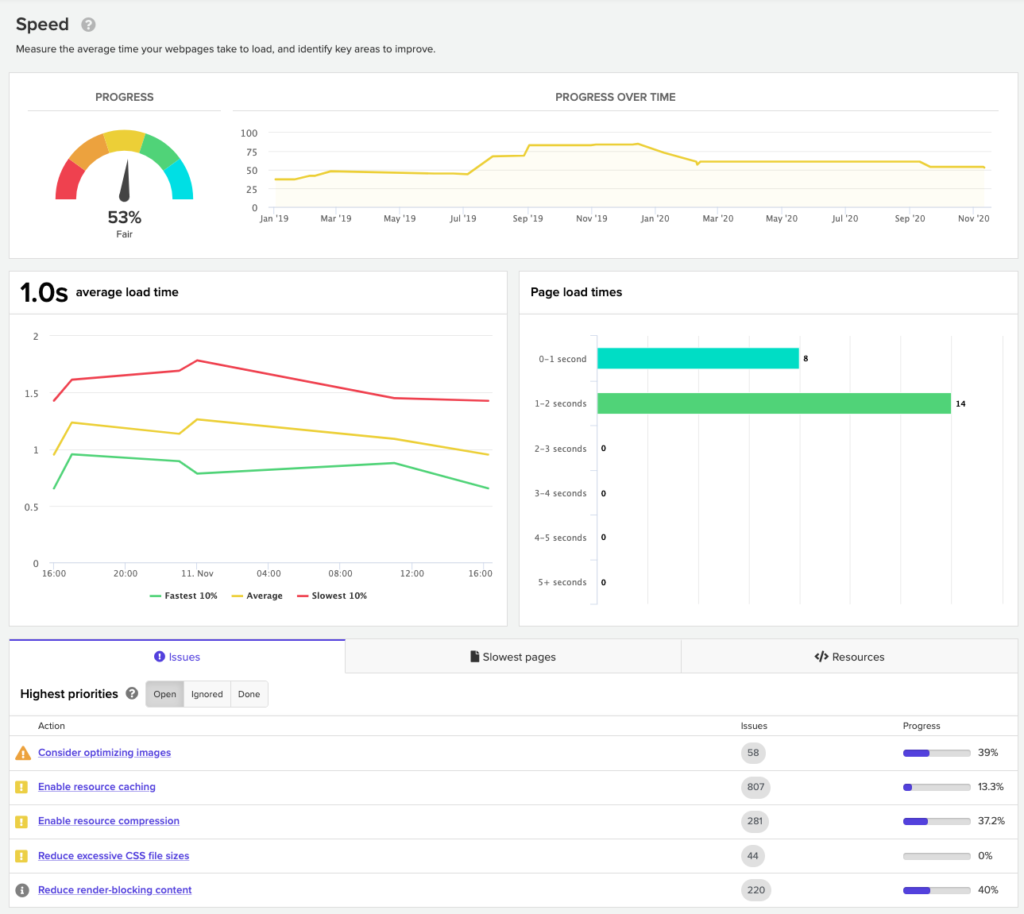
Speed screen
This screen measures the speed of the website, as perceived by your users.

Speed is measured as load time, or ‘how long pages take to fully load’. The graph of page load times shows how many pages in this website take a certain amount of time to load, e.g. “16 pages take between 1-2 seconds to load”.
This screen also makes technical recommendations on how the speed of the whole site and individual pages could be improved.
What it covers
Silktide performs the following checks for each webpage:
- Is browser caching enabled?
- Is HTTP/2 used?
- Are CSS files minified?
- Are JavaScript files minified?
- Are appropriate files compressed via GZIP or equivalent?
- Are any files missing?
- Are any elements blocking the render?
- Are any pages slow to load overall?
- Are any pages slow to respond (TTFB) overall?
- Are images optimized for speed/size?
- Are there excessive font files on a page?
- Are there excessive JavaScript files on a page?
- Are there excessive CSS files on a page?
- Is the HTML for the page too large?
- Is the CSS for the page too large?
- Is the JavaScript for the page too large?
- Are the fonts for the page too large?
Speed recommendations are often technical in nature and may require a qualified developer to implement.
Why it matters
Speed is one of the most significant aspects of website user experience. Users are more likely to abandon websites the slower that they are, and the sensitivity to speed is extremely high; an Amazon study discovered that every 0.1s they added to their load time resulted in a 1% reduction in sales for that user.
Speed is now considered a ranking factor by Google, meaning that slower websites will, on average, rank lower than faster ones.
How to use it
Recommendations for how to improve speed are listed in a table. These are sorted with the most severe first. Once an issue is resolved, it turns into a green tick:

For each page, you can see:
- Magnifying glass – this opens the Inspector, which shows you technical details about that page and how to make it faster.
- Load time – how long that page took to fully load.
- Size – the size of the page, or how large all of the files that it uses are in total (uncompressed)
Click on the magnifying glass next to a page to see specific recommendations on how to improve that page.